
Whenever someone comes in late and calls for the continuation of the trend with very bad timing the exact opposite tends to happen.
This is an unconventional signal yet a reliable one. There isn’t much time left.
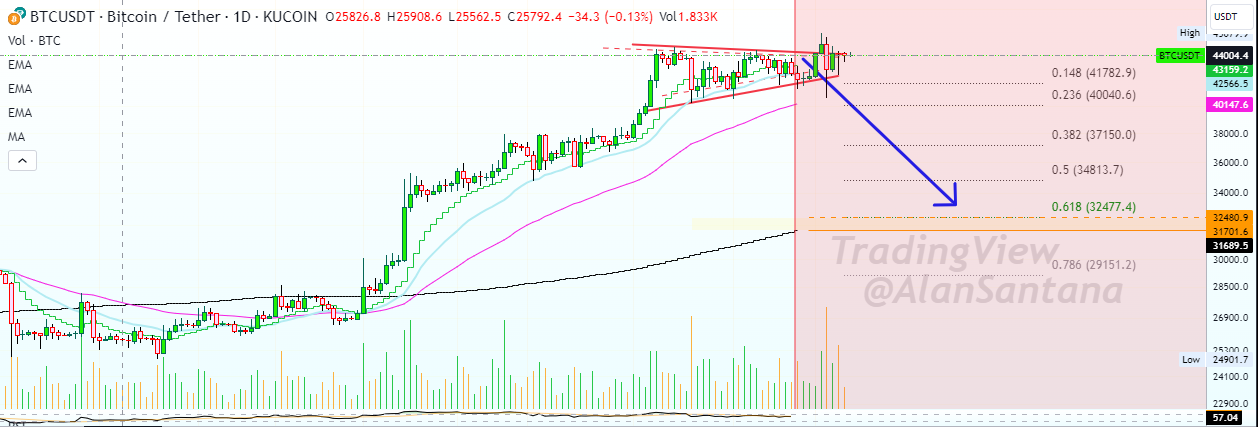
The truth is that Bitcoin continues to produce lower highs, failing to push prices higher.
The last peak has not been challenged once, each bounce ends before reaching it.
The biggest bear volume on a daily bases came in 2 days after the peak, 11-Dec. This is the highest sell volume Bitcoin have seen daily since April.
➖ BitcoinSV tends to grow when Bitcoin peaks.
➖ Perpetual Protocol tends to grow when Bitcoin falters.
These two went bullish recently.
Correction is now confirmed and might start Friday, 29-December 2023.
Namaste.
We know the Adam & Eve pattern as a bottom formation and here this pattern is showing as a top, in reverse:
We already know of the lower high, trading below EMA10, decreasing volume, bearish gold, BNBBTC going up, LINK, ADA, and all major Altcoins going bearish, etc.
This is just additional data in support of a drop.
EW is also pointing lower…
This on rising bear volume. (confirms within 1 hour if Bitcoin closes below $42,444 —if not ignore this…)
➖ Moving and closing below EMA10 signals that short-term bearish potential is now active.
➖ Moving and closing below EMA21 signals that this short-term bearish potential has been confirmed.
EMA21 here is the bold slate blue line.
Notice how the daily RSI moved below 50, as well supporting a bearish bias.
These are just chart signals of course, but they are no longer pointing up.
Notice how in mid-November when I went bearish ahead of time Bitcoin still traded above EMA21 and the RSI was bullish, so I obviously jumped the gun and not to make excuses but I mentioned that the potential existed for one final jump.
Right now things are different.
The RSI peaked late October and so we have a two months long bearish divergence.
“Above 40K is super bullish”… Here is the problem, when the drop starts it will happen so fast and by surprise, so from 40K it can go straight to 37K and only hover around this level a few hours or days before the next support level is hit and then the next one.
Then it starts to recover fast just to produce a lower high and then continue to produce more of a correction… It becomes hard to trade, hard to read the chart, hard to guess.
It is easy to see incoming change but it is very hard to predict exactly how the wave will develop, when and where will prices bounce, how long the bounce lasts, if it goes lower or not… These are the questions that will hovering around your mind as soon as Bitcoin drops. If you prepare now, you can just sit back, relax, watch it all develop and then take action again once a new support level is established.
I will be here sharing charts and trade ideas days or maybe even weeks before the bottom low support hits.
I might be early as usual… But you will be able to know ahead of time when the trend is going to change.
We are due for a correction, even if Bitcoin moves up to hit 48,000 or 50K.
Namaste.
…It leads to a correction.
I also noticed that in some instances Bitcoin moves daily below EMA21 just to recover the next day… There exists this possibility that a fake breakdown happens and Bitcoin resumes higher, as it happened multiple times in the past. So not all is bad news.
With that said, moving below EMA21 coming off a major high after a lower high with a bearish RSI is a bearish signal.
You can see the values I used as 1,2,3 on the chart.
➖ Notice that the golden ratio at 1.618 results in exactly $44,753.18.
➖ Bitcoin peaked 8-Dec at $44,715.44. This is a major resistance level which can turn into a major turning point.
0.5 Fib. extension worked as resistance both in April and June/July 2023.
It took Bitcoin 192 days to break this level and this included two minor retraces.
Based on the law of alternation, since we had two retraces in this instance we can have a strong.
There is very strong support around $25,000. Of course, $34,500 and $31,000 go first.
Namaste.
The daily session closes in less than 2 hours… So far Bitcoin has not challenged 8-Dec resistance once.
We have lower highs based on candle close and also candle wick.
We also see the action happening below EMA10 and EMA21 with decreasing volume.
RSI is on the bullish zone at 51 (not shown here).
These are the basic signals.
One unconventional signal: Negative news is starting to pop up. As the bullish wave was in full swing there was not a single bit of bad news… As we reached this point, a strong year+ long high, negative news are starting to develop. These so far have no effect on the market.
Signs of stress: I am noticing some sign of stress coming from my dear bulls. I see some FOMO on many of the smaller pairs yet the breakouts and candles are not as big as earlier this week or last week, it seems it is slowing down.
People are becoming reactive, people are fighting, I am receiving insults and things of this nature. This never happens when everything is going perfectly, this tend to happen when there is change about to take place. The reason people are reactive is because subconsciously they know something is coming they just don’t know what it is consciously and it affects their behaviour. Since they are not well prepared they take it off with anyone who disagrees with their point of view.
Let me tell you, there can be another wick up… We can have another two weeks up… Not my point, the bullish force/momentum is weakening based on all this information that I’ve been sharing with you. This too can change and we can have forever growth, but I am sharing the current moment, this moment now, how the market is acting, what it is doing, its players, its feelings… What is the chart saying now, today?!
Let us look at some of the TOP10 Altcoins together, shall we?
Tomorrow we will close a weekly candle, a yearly candle and a monthly candle…
ETHUSDT:
Notice the 9-Dec high. 28-Dec ETHUSDT tries to push forward but is rejected and ends up closing red and below 9-Dec peak. A bearish rejection.
This also produces a double top pattern.
The current action is still happening above EMA10 and EMA21 so not all is lost but the rejection is bearish.
We could also say that resistance is being challenged, if it continues to be challenged it weakens and ETHUSDT can move higher. This has not been duplicated on BTCUSD.
Let’s move on…
BNBUSDT is in the process of a bullish breakout, bullish weekly. Bullish short-term. Too early to read any potential correction signals. This one is ok.
SOLUSDT:
Solana produced massive growth since last year and is facing resistance in multiple forms. The first red session after parabolic growth. Any and all type of parabolic growth ends in crash-type corrections.
It went up beyond 4.618 of the fib-trend based extension numbers.
It stopped below 3.618 of the fib extension numbers.
It stopped at the April/March 2022 price level, exactly where we thought it would stop.
If it were to continue higher it would produce only one more wick to the upside just to crash down faster and stronger than if it crashed today.
Bearish potential is high here as well.
Let’s continue…
XRPUSDT: No movement, correction since July. Bearish.
ADAUSDT: Cardano is a bit mixed. It failed to produce a new high compared to mid-December but the signals are mixed. Weekly it seems like it can continue going with just a small bullish push. Daily it seems to be neutral, hanging by a thread. It can go straight up just as it can go straight down… But a big move is pending, that’s what the chart says.
I have updates for DOGE, DOT, MATIC and LINK, these are failing. Bullish technicals with bearish potential developing. No follow through. Again, change can easily happen here but it hasn’t and volume is dropping too much at such high prices. When we get a continuation and prices are this close near resistance volume remains strong. When we have a retrace that will resume higher volume can drop and rise again once the follow up takes place.
Bitcoin in relation to the Altcoins Analysis Conclusion
We have some mixed signals. The pairs moved higher but all stopped at resistance. As the pairs stopped at resistance market conditions are starting to change. People are becoming agitated, FOMO, indecision, fighting, trolls… All signals that the positive vibe is waning and the bears are trying to take control.
My personal assessment is that we are moving from a bullish wave, to a market-wide retrace.
Correction for the bigger ones, retrace for the smaller ones.
Long-term and medium-term higher lows all across, then massive ultra-growth in 2024 and beyond!
Namaste.
It seems we get for about 1-3 weeks more sideways or one final jump before the major correction…
Stay tuned!
1) Daily TF
➖ Full red. The last three candles produced a bearish pattern.
➖ The RSI peaked 28-Nov. (bearish divergence).
➖ Highest bear volume compared to previous days.
2) Weekly TF
➖ A shooting star. Bearish candlestick pattern signals a top.
➖ First week red after 8 weeks green.
The market won’t open until tomorrow… While it can grow through some sort of miracle, the signals are extremely bearish.
Delay or no delay by the SEC the chart isn’t looking good.
➖ If the SEC delays all applications, that’s strongly bearish for the market.
➖ If the SEC approves anything, that’s bearish for the market as a “sell the news” event.
Do you agree?
What’s your take?
Namaste.
Trading volume is very low, the RSI is yet to rise.
We need to wait for the daily session close. A close above $45,000/$46,000 is needed for bullish confirmation.
If Bitcoin closes below this levels or worse, moves below the last high ($44,700) then it is going to crash sooner than expected.
The more it takes to drop though the better it is because the Altcoins that are yet to awaken have a chance to move up and grow. We are strongly bullish on the small and mid-sized Altcoins.
Remember to comment and follow.
Thanks a lot for your amazing support.
Namaste.
Do you guys think it would be wise to go long here at $45,500?
And just wait for the launch of the Bitcoin Spot ETF and go towards $100,000…
Let me know in the comment.
Should I go long at the maximum top after 1 year and 2 months of sustained growth? Or just cut my losses and move on…
👉 83 Million dollars liquidated worth of SHORT positions in the past 24 hours.
Bears are having a hard time right now…
This is likely going to be the catalyst for the major pre-halving correction.
(If approved, same results… Crash/correction!)
Poladot | DOTUSDT = bearish
Solana | SOLUSDT = bearish
Chainlink | LINKUSDT = bearish
Binance Coin | BNBUSDT = bearish
All those major Altcoins that I shared recently with you failed to move higher.
Just be careful… The market moves in waves… Up and down, up and down…
It has been going up for a while, it can turn and start going down at any time now.
It is wise to look at those trading low/near support (buy low).
Those that are high up have high probability for a correction to happen… It is still early based on this signal, but it is ok to be careful.
We will see what happens tomorrow or the day after…
Namaste.
BTCUSD and COIN move together. If one drops, the other follows.
This works as bearish confirmation.


I remember this clearly, when Bitcoin was crashing in 2022, BNBBTC was in a bull-market, higher highs and higher lows.
As Bitcoin recovered in 2023, BNBBTC was in a bear-market, lower lows and lower highs.
Now BNBBTC is having a major bullish breakout (going up)…
It is likely that BTCUSD is going down…
March-November 2022 | BNBBTC goes up
BTCUSD goes down
___
December 2022 – December 2023 | BNBBTC goes down
BTCUSD goes up
___
December 2023 – ??? | BNB goes up
BTCUSD goes down